Last Updated on: September 30th, 2020

Infographics have become extremely popular, and they are the best way to rank your blog on the first page of Google these days. Every professional blogger is using infographics to promote their online business quickly.
However, for many bloggers (such as myself), creating graphic designs is hard.
That is why, when one of my fellow bloggers, Hemant Kumar, approached me with an idea for a guest post about free tools to use to create infographics, I decided to collaborate with him and a couple of other people to create this ultimate guide to infographics!
CONTENTS
The contents of this guide include:
What Infographics Are
Why Infographics Are So Popular
How Infographics Relate to Learning Styles
The 3 Main Benefits of Using Infographics if You’re a Blogger
How to Create An Infographic
Which FREE and PAID Tools You Can Use to Create Infographics
TUTORIAL #1: How to Create an Infographic Using Canva
TUTORIAL #2: How to Create an Infographic Using Venngage
TUTORIAL #3: How to Create an Infographic Using Piktochart
TUTORIAL #4: How to Create an Infographic Using Visme
TUTORIAL #5: How to Create an Infographic Using Easel.ly
Why You Should Start Creating Infographics TODAY
Infographic Design Tips
This guide is completely FREE to you and took a VERY LONG TIME to put together!
To show your appreciation, please make a small donation to Lorraine.
That’s me, and I am the owner of Wording Well. I would appreciate any donation you can make… even if it’s only $5!
DONATE NOW!
What is an Infographic?
An infographic is basically an image that is used to convey information about a particular topic to someone else.
Infographics are used mainly to display data.
According to Visual.ly, infographics are “data visualizations that present complex information quickly and clearly.”
Infographics are becoming more and more popular in our current era due to:
- Our shorter attention span for reading long articles
- Social media platforms that focus on visual content, such as Pinterest
Why Are Infographics So Popular?
Infographics are one of the most potent marketing tools available on the internet today. Everyone loves them. Consumers love them. Marketers love them. We share the heck out of them on social media. In fact, 4 specific infographics got over 10000 social shares!
Infographics, when used correctly, are an excellent asset to enrich your content marketing strategy.
According to a study by Hubspot, “34% of marketers confirmed that visual assets are their most valuable content.” This becomes more impressive when you consider the fact that a picture is worth a thousand (or even a million) words.
Infographics are also usually very easy to read and understand. According to Wikipedia, “They can improve cognition by utilizing graphics to enhance the human visual system’s ability to see patterns and trends.”
Furthermore, a survey by the Social Science Research Network shows that “65 percent of the world’s population categorize themselves as visual learners (including myself).” Similarly, eye tracking studies have confirmed that internet users pay more attention to information containing images. Basically, consumers respond to the combination of text and visual in a concise, informative way.
However, the key to an infographic, apart from being visually alluring, is to also communicate useful information. That component is vital. Interestingly, we’ve noticed that infographics are a perfect way to turn “boring,” uninteresting topics into a captivating and attractive visual.
An excellent infographic can transform something that, in a text format, would just be a long, boring list into a fascinating visual representation of information that is informative, entertaining, and aesthetically pleasing.
Take a look at this infographic on 50 Productivity Tips to Boost Your Brainpower as A Writer that originally appeared on Write to Done. You are more likely to absorb these tips through this visual than you would through a mere text list!

(Infographic brought to you by Wrike)
How Infographics Relate to Learning Styles
More than 40% of people prefer to learn something visually. They respond better to visual information than text.
NOTE that there are 7 styles of learning:
- Visual (spatial): These people prefer using pictures, images, diagrams, colors, and mind maps, and spatial understanding to learn.
- Aural (auditory-musical): These people prefer using sound, rhythms, music, recordings, and rhymes to learn.
- Verbal (linguistic): These people prefer using words, both in speech and writing to learn.
- Physical (kinesthetic): These people prefer using their bodies, hands, and sense of touch to learn.
- Logical (mathematical): These people prefer using logic, reasoning, and systems to learn.
- Social (interpersonal): These people prefer to learn in groups and work with other people as much possible.
- Solitary (intrapersonal): These people prefer to work alone and through self-study.
Generally, among all the 7 styles of learning mentioned here, people prefer visual learning. According to research, “people following directions with illustrations and text do 323% better than people following instructions without illustrations.”

Similarly, it has been found that “Infographics are shared and liked on social media 3X more than other types of content.”

With that being said, you’ll agree with me that infographics are critical to today’s learning.
In today’s world, many people have shorter attention spans and now prefer visuals to text.
(I won’t let this deter me from writing, however, as there are people, such as myself, who LOVE to read, and will take the time to read a blog post, an e-book, or a novel.)
But… some visitors will turn away from a website upon seeing pages and pages of words. The words you will often hear them say are:
- There are too many words
- I hated reading it
- I didn’t understand what was being said
- I see these and I fall asleep
I get it. Sometimes, visual representations are better than reading some text.
Information overload is a major problem in the world today, and good visual design is indeed the key to an entry barrier. Excellently designed “visual information” invites readerships.
To prove this, look at the following comparisons. I know the image is more visually appealing AND it is easier to understand, at a glance!

(source)
The 3 Main Benefits of Using Infographics if You’re a Blogger
There are many benefits of using infographics if you’re a blogger.
The 3 main ones are:
- To drive traffic to your website
- To build backlinks
- To earn more money
We will look at each of these in more detail now.
Benefit #1: You Will Get More Website Traffic
It’s no secret that Pinterest users love infographics.
So do bloggers.
If you’re a blogger, you should be sharing your blog posts on all social media platforms.
Why? For more exposure, of course!
Smart bloggers have learned that Pinterest can drive a lot of traffic to your website.
Bloggers who use infographics on their sites get more eyeballs on their content, more clicks on their links, and can even earn more money as a result.
Writing or creating your blog posts is only one component of blogging. Promoting them is another. (So is blog commenting, building backlinks, optimizing your site for SEO purposes, etc. There are many components to blogging, remember!)
It has been said over and over again that humans are visual creatures. Hence, people are easily attracted to interesting visual elements. People need the optic nerve enabled so as to process over 90% of the information that comes into one’s mind on a daily basis.
Now, if words finally fail to attract the imagination and attention of your audiences, then visual elements like “Infographics” can, perhaps, do a better job at that.
The screenshot below shows the result of a study carried out by Barbara Miller and Brooke Barnett demonstrates the importance of graphical or visual elements quite well:

This goes to say that Infographics when combined with well-written text, can be a very formidable tool to enable your content pass through the information jungle and get into the brains of your targeted audience.
Humans naturally love figures, stats, facts, and other graphical elements that spice up information, and if compelling and enchanting enough, the information in your Infographics can really grab their attention thereby driving more traffic to your site.
Furthermore, information compiled by MDG Advertising shows that content with visual elements like infographics or compelling images can drive 94% more views than simple text or content that does not contain any images. The same report equally confirmed that press releases can attract up to 14 percent increase in page views if the article includes a photograph.
Infographic by MDG Advertising
Now, the primary characteristic of Infographics is a strong visual content that is really attractive to a lot of people so much, that most of the viewers would want to share it via their own circles of influences and social networks. As a result of this, the content can really go viral as more and more people like and share the Infographic on their various social media channels.
Benefit #2: Use Infographics to Build Backlinks
Infographics are an excellent way to approach link building. This is because infographics are completely likable and shareable.
Apart from that, they equally send people directly to your website and are totally easy to brand with your own styling and colors.
As Infographics go viral, it will consequently lead to your content having better search marketing results.
Not only do infographics contain your contact information, but embedding and sharing the material on social media networks or other online marketing channels can generate a massive number backlinks to your website. This will happen whenever your Infographic is syndicated and used by other bloggers for their content provided they link back to the primary source – you! This is much better than building backlinks through black hat methods!
All these will result in an abundance of inbound links which can really increase your search rankings. To make it even better, you should add some highly targeted keywords as part of the title and Meta Description of your Infographic. With this, your Infographic will have higher chances of showing as a relevant image or resource in search results.
I’ve seen many bloggers paste the HTML code below their infographic, for others to copy and use on their sites. It looks like this:

To do this yourself, create an infographic and provide the embed code to others so they can copy it!
2 Ways for How to Provide the Embed Code to Others
1: Use the Embed Code Generator plugin (NO LONGER AVAILABLE)
OR
2: Use the Siegemedia embed code generator tool, like Ahfaz Ahmed does.
You just add your website URL, image URL and it generates the code you can add in your post.
How to do this:
Step 1: First go to Siegemedia embed code generator tool.

Step 2: Fill these boxes:
-Your site name
-Your post URL that contains your infographic
-Your infographic URL (image URL)
-Your infographic Alt (image alt)
You can leave the rest of all boxes blank because, by default, the width and height are already perfect.
Now just copy the code from the “Use This Code” box and paste it into your post.

That’s all! Now you have successfully added this awesome feature to your website.
Benefit #3: Earn More Money
This benefit is a result of Benefit #1.
Why?
If you have AdSense installed on your site, chances are you will earn more money with the increase of traffic to your site. Visitors will click on the ads, and you will make money. It’s that simple.
If you sell a product or service on your website, your visitors might click around while they’re on your site. Perhaps they will visit your Services page. Perhaps they will shop at your store. Perhaps they will buy your product, take your course, buy your books, or make some other sort of purchase.
Whatever your visitors decide to do (or buy), the chances of you earning more income is increased with the increase of traffic to your site.
Infographics can also generate leads and sales. Read How to Create Infographics that Generate Leads and Sales for more info on this.
You can also use infographics in PowerPoint presentations.
How to Create an Infographic
There are several steps to follow in infographic creation.
They are:
Step 1. Gather your information.
Facts and stats (statistics) need to be 100% accurate. Therefore, gather your information from multiple sources. Double-check to ensure that your sources are reliable and that more than one place says the same thing.
For example, facts are not always facts. We only think they are! Any ONE website can report or assert that 89% of people are (whatever they are), but if 10 or more sites assert the same thing, then you can accept this assertion as a true.
Be sure to quote any resources you have used wherein the information you have found does not fall under the “fair use” category. To learn the difference, read Plagiarism (VS Fair Use): What Bloggers Need to Know.
Step 2. Choose a FREE or PAID tool to make your infographic.
There are a lot of best blogging tools available on the Internet which every blogger uses for their blogs, just like there are a lot of tools available on the Internet to create awesome infographics.
Infographics can be made using a variety of tools, all found online.
You can use any of these FREE tools:
Canva – use any of these free templates!
You can also use these PAID tools:
ChartsBin (although someone said this is not a good option because it is difficult to use!)
Step 3. Create your infographic, making it as eye-catching as possible!
Infographics should be easy to read, easy to follow, and easy to understand.
They should also present factual information (which is why it is important to carefully research in Step 1).
Infographics should be colorful too.
This guide is completely FREE to you and took a VERY LONG TIME to put together!
To show your appreciation, please make a small donation to Lorraine.
$5, $20, $50, or whatever… any amount is appreciated!
DONATE NOW!
TUTORIAL #1: How to Create an Infographic Using Canva
To create an infographic using Canva, follow these steps.
Step 1: Go to Canva and create a free account.
Step 2: Now login to your account. Once you have successfully logged in, you’ll see your dashboard:
Step 3: On your dashboard, you can see lots of categories. You have to scroll down and search for the Blogging & eBooks category. Under this category, you have to choose the last one, which is Infographic.

Step 4: Click the Infographic option. You’ll be redirected to a new screen.
Step 5: On this screen, you will have to choose a free infographic template (provided by Canva) from the left sidebar.
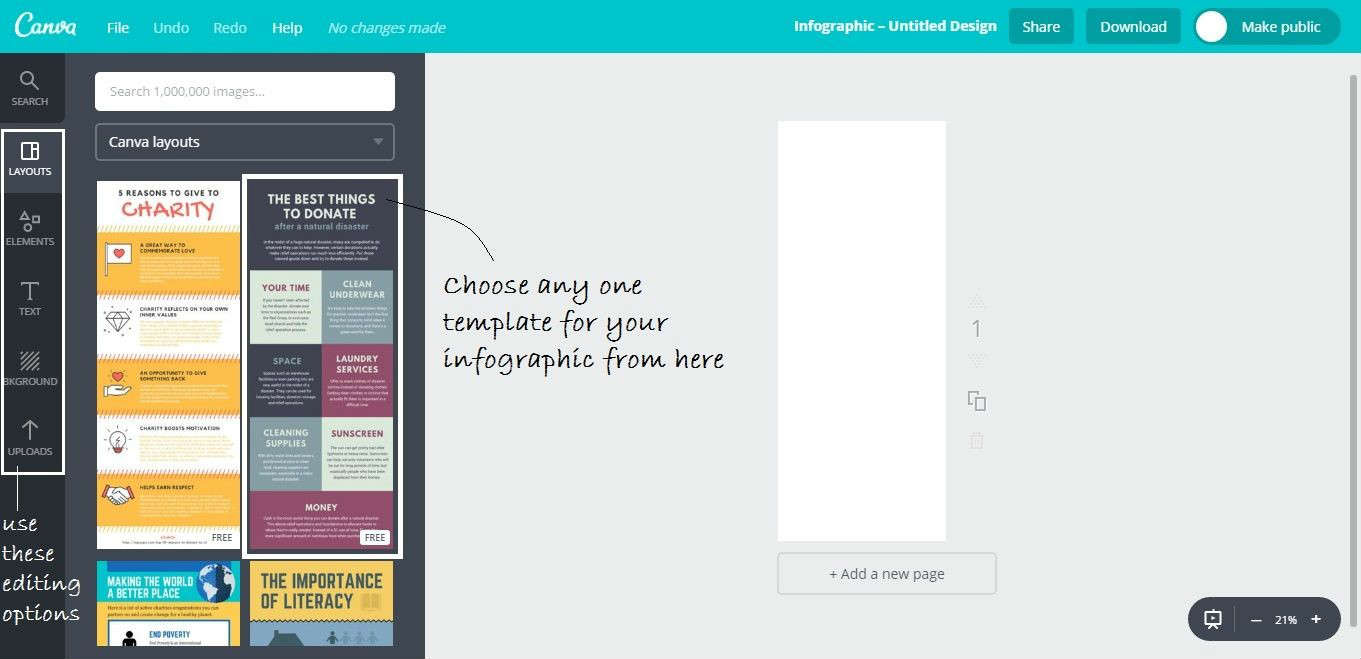
If you are using a free account, then you should only use the free templates. You can see the small highlighted word “FREE” at the bottom right corner of the templates that are free.

Step 6: Now you can edit the template according to whatever you want to do with it! Just simply click on any text or element you want to edit.


Step 7: If you want to add some elements, then go to the Elements tab. You’ll see lots of categories like shapes, icons, lines, charts, etc. If you want to add icons then click on Icons. A box of icons will open, and you can choose whichever one you want. Be sure to choose the ones marked FREE.

Step 8: If you want to add some specially designed text, then you have to go to Text tab. There you’ll see lots of text formats. Just choose whichever size you want and simply edit their text by clicking on it.

Step 9: If you want to add custom photos, go to the Uploads tab and then click on the green button called Upload your own images. Once uploading is done, click/tap on your photo and it will be added to your infographic. You can then adjust the size of the photo easily. But make sure that you use only high quality images on your infographic otherwise bad images will make your infographic ugly, you can use these awesome sites to get some high quality stock photos for free.

Step 10: These are the main features of Canva, Once you have completed your infographic then click on Download button on the top right corner and then select the File Type like jpeg or png and then just click on the big green Download button.
TUTORIAL #2: How to Create an Infographic Using Venngage
This tutorial was prepared by Adarsh M, who has even written a review about Venngage. (Thanks, Adarsh!)
Step 1: Go to Venngage.com and Click on SIGN UP FOR FREE and you will be redirected to a registration page.
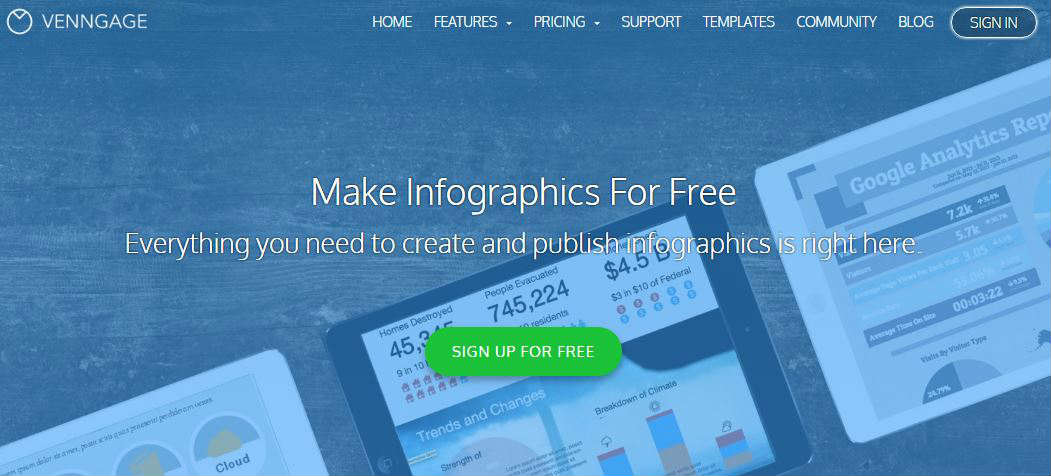
Step 2: Now, you have three options to register your free account. You can register using Email, Facebook, or Google Plus. Choose whichever is best for you.
Step 3: This is the dashboard that you will see after signing up. You will be redirected to this page and here you can choose a template or can start with a blank template for your infographic.
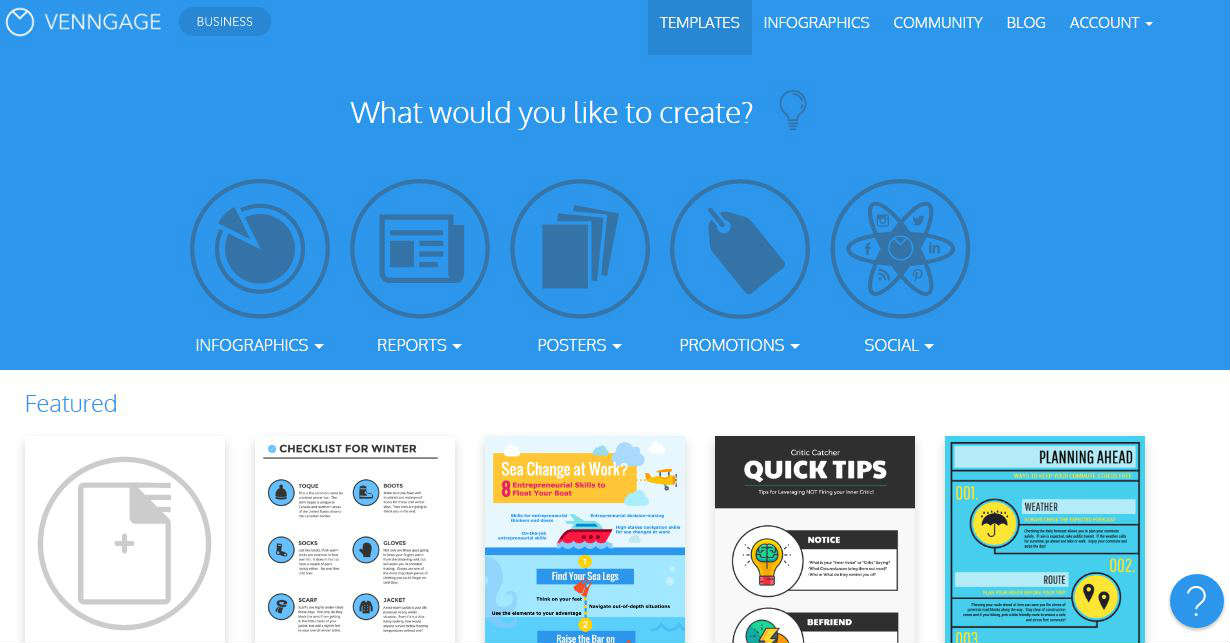
Step 4: You can see some categories like INFOGRAPHICS, REPORTS, POSTERS, PROMOTIONS, and SOCIAL. Point your mouse pointer above any of these categories and you will see the subcategories. Click on any of the subcategories and you will see the templates related to that category.

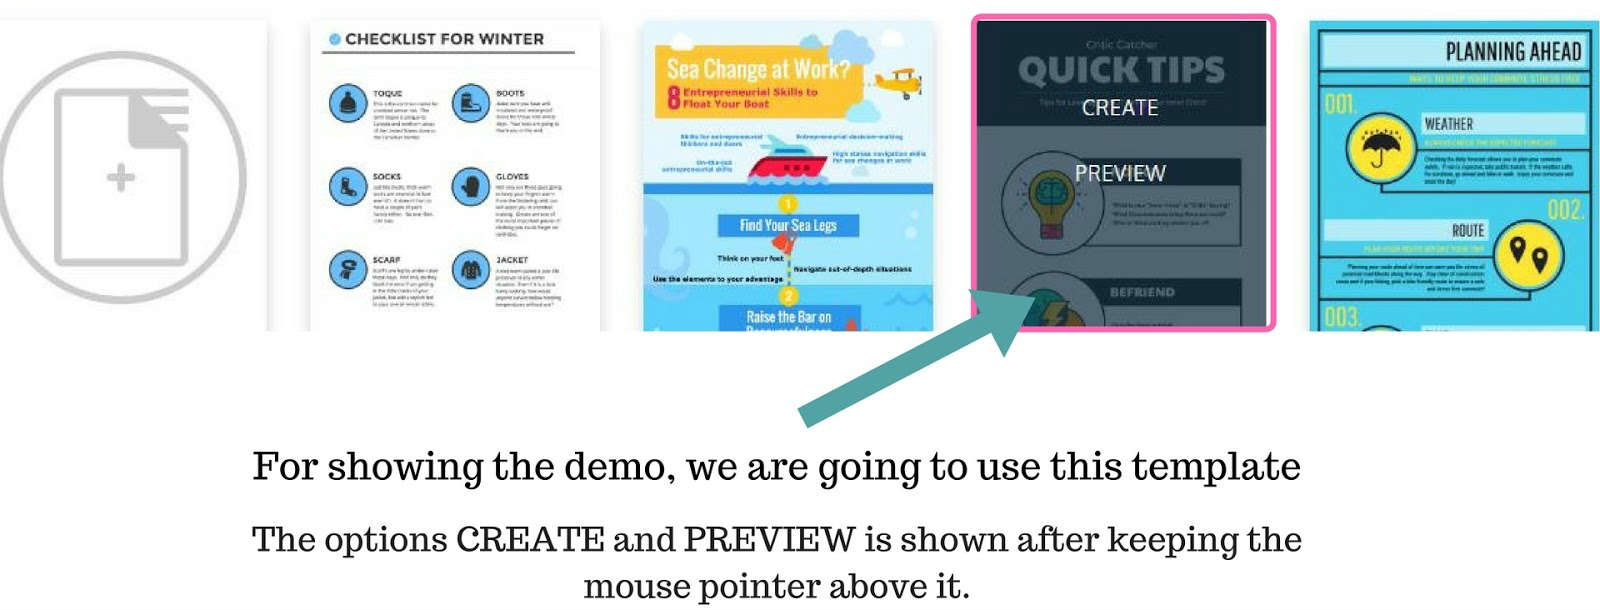
Step 5: Let us take the template Quick Tips for showing the demo here.
When you point your mouse pointer above any of the templates, it will show two options, CREATE and PREVIEW.
Click on CREATE and you will be redirected to a page of where you can edit the template.
Click on PREVIEW to see the complete template before using it.
Step 6: Here you can edit the infographic easily by drag and drop and with few clicks.
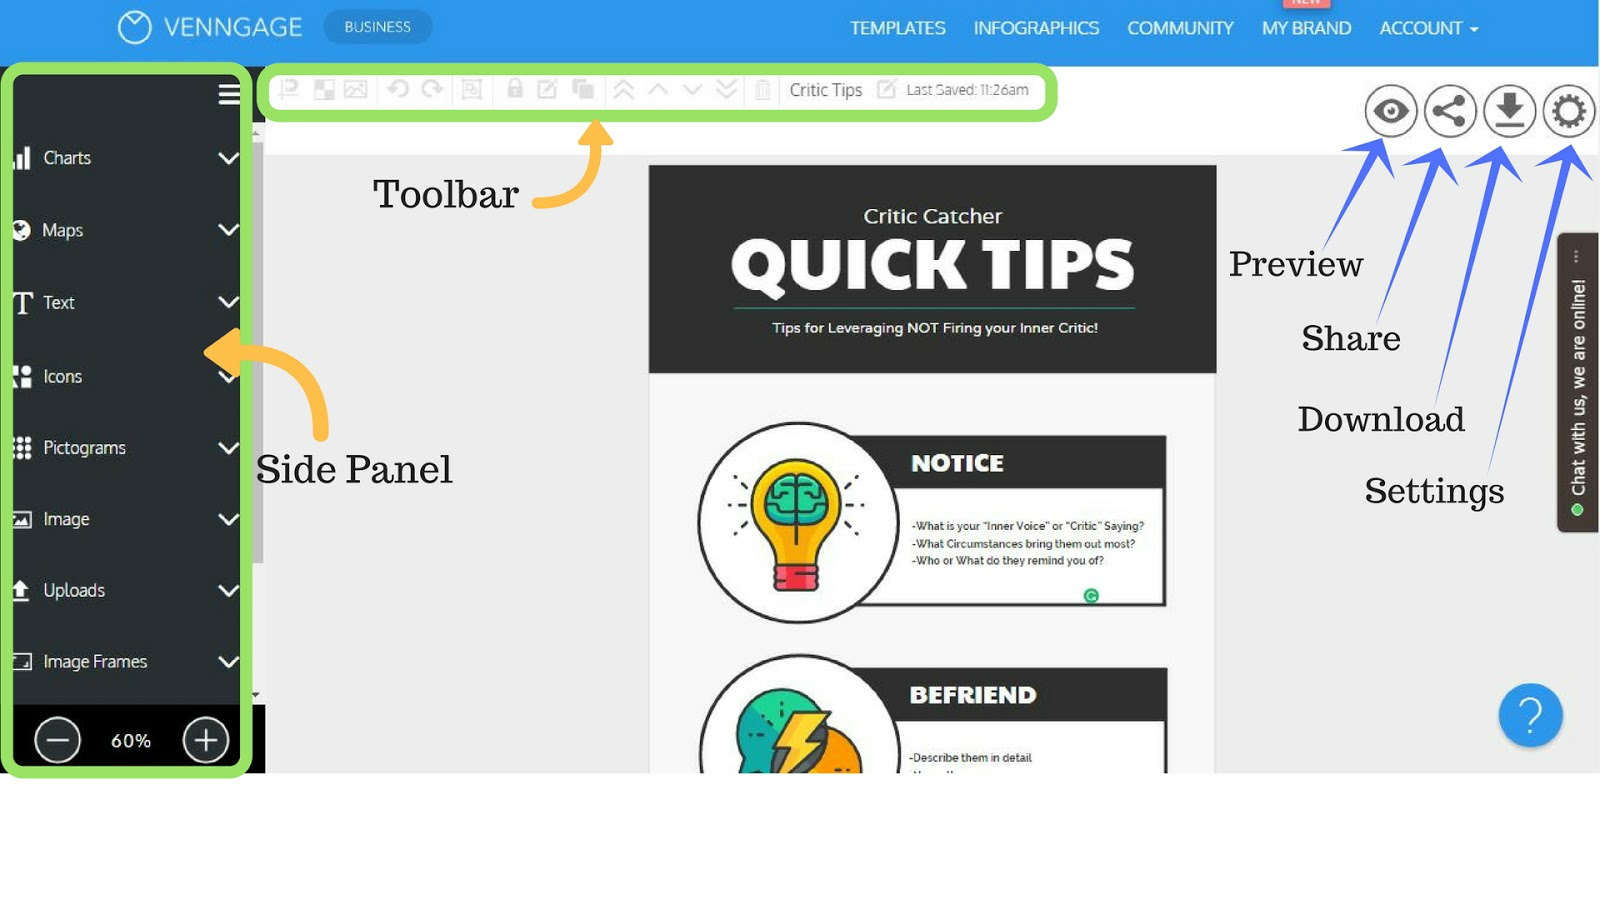
Step 7: Click on the text you want to edit and select it. Now, in the toolbar, you will see options like Font, Color, Size, Alignment, Lock, etc.
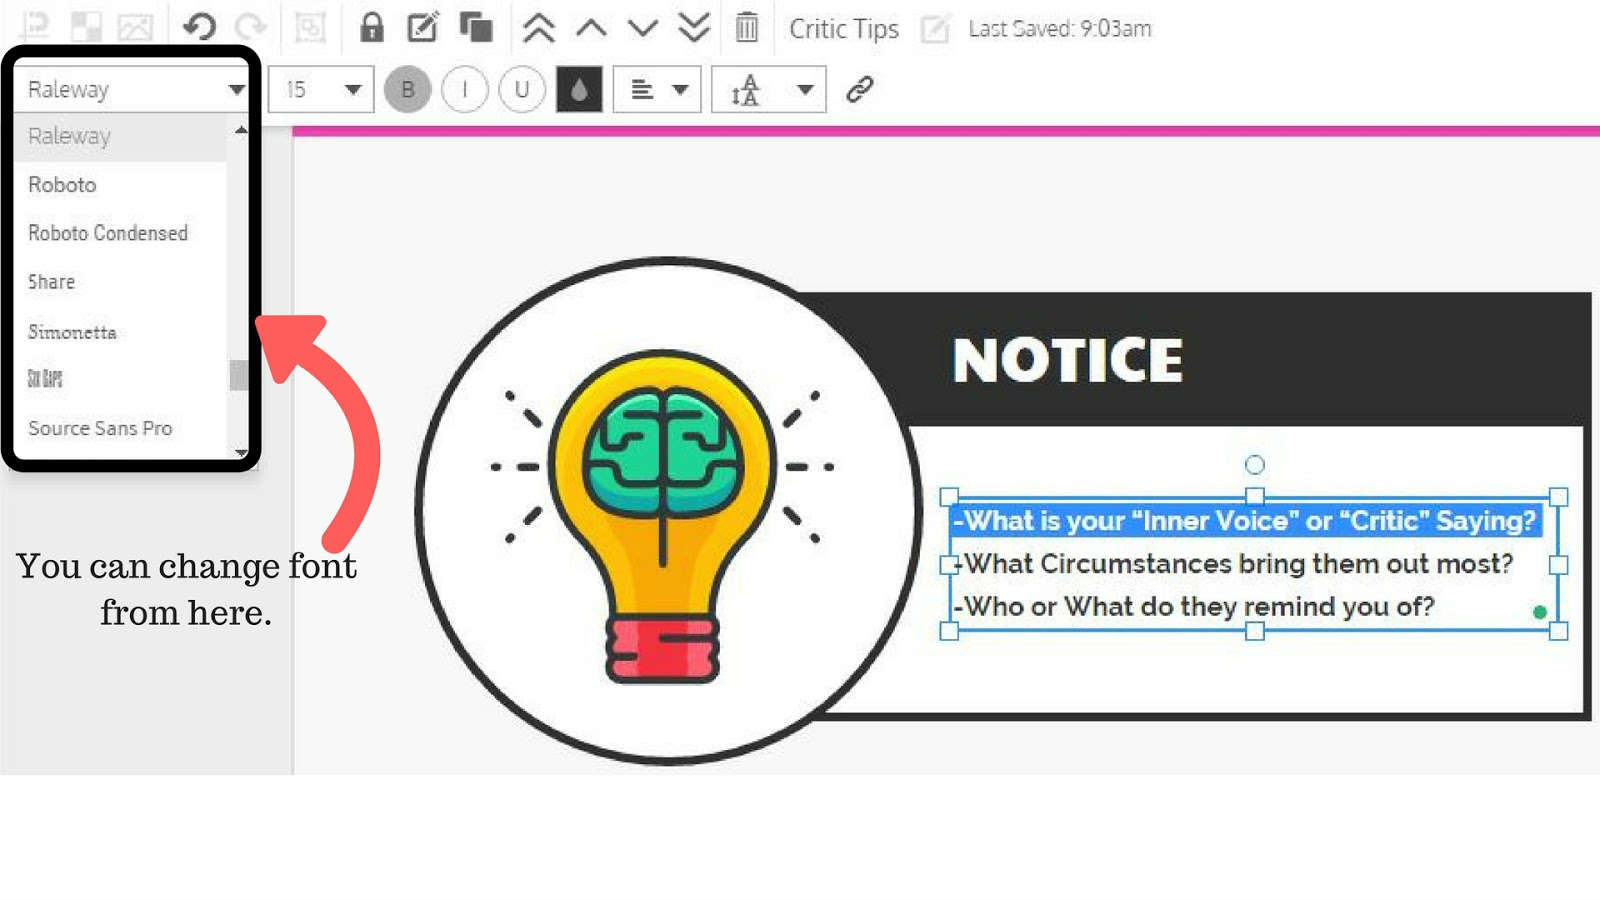
Step 8: In the left side panel, you will see options like Charts, Maps, Text, Icons, Pictograms, etc. You can use these extra features to add more information to your infographics.


There are different types of charts and you can edit the data with a simple click.
To add a chart, click on Charts from the side panel and drag-and-drop the type of chart you want into the infographic.
And to edit the chart, double-click on it and a box with settings will appear and you can make required changes to it.
You can change the chart type at any time by clicking on the chart type. And you can change the data for the chart in the spreadsheet in the settings.

Step 9: You can use other features like this to make your infographics better and informative. After making all the necessary changes, you can Preview your infographic.

Step 11: You can Preview the Infographics by clicking on PREVIEW option. By clicking on PUBLISH, you can also publish it on the Venngage Community page.
After seeing the preview, if you are satisfied with it and if you want to download the infographic you made, you can download it.
You can download your infographics in different formats. Click on any of the desired formats to download your infographics.
And it’s all done.

TUTORIAL #3: How to Create an Infographic Using Piktochart
This tutorial was created by Nadeem Ahmed.
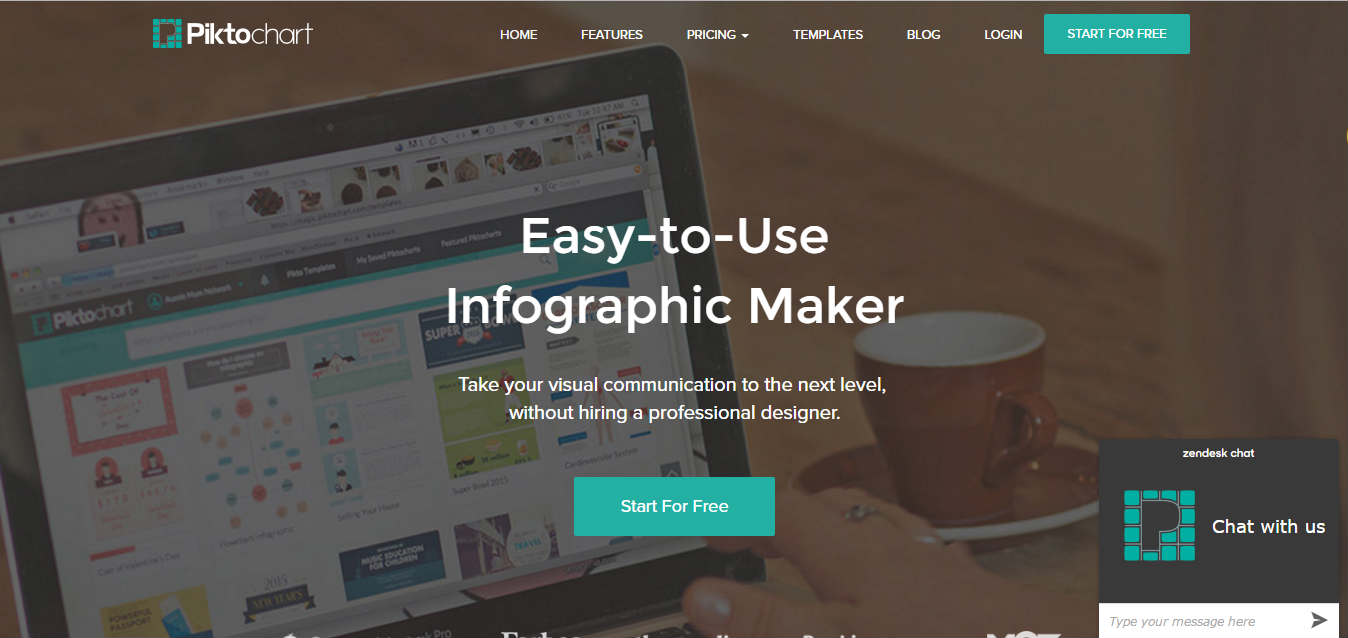
Step 1: Go to Piktochart website and create a free account.
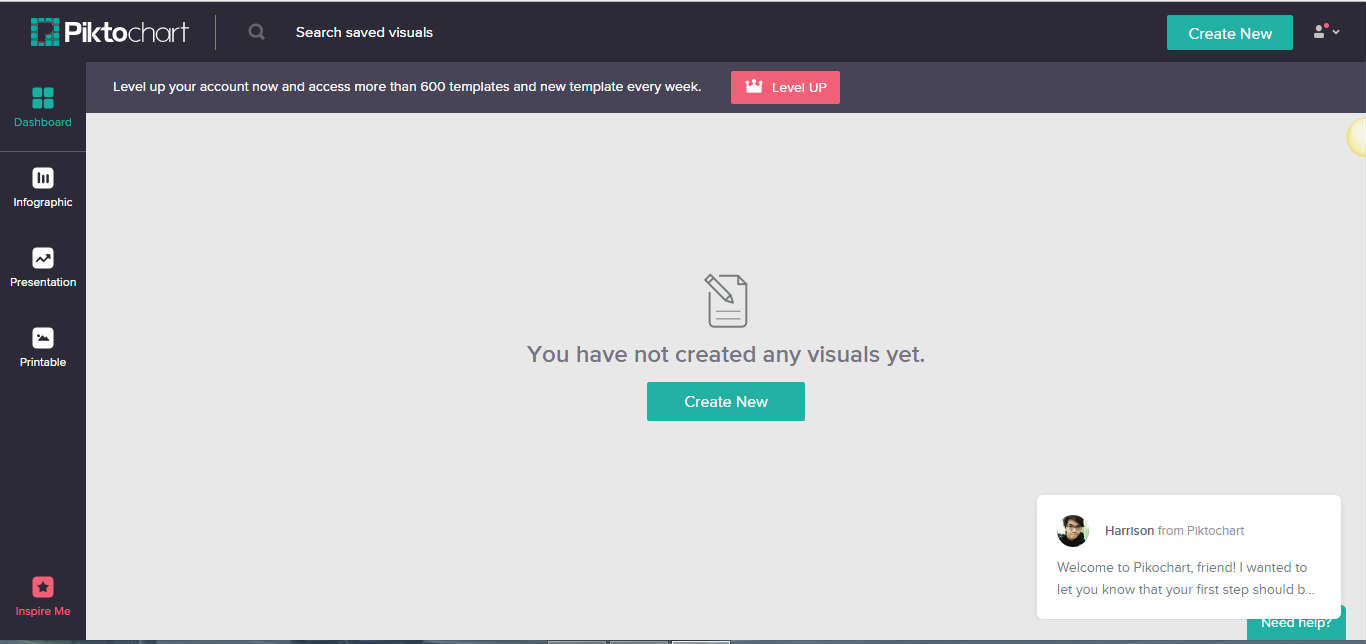
Step 2: When you’re done with the registering procedure, you will see categories on the left side. Just choose Infographic.
Step 3: Click the Infographic option. You’ll be redirected to a new screen.

Step 4: On this screen, you will have to choose a free infographic template (provided by Piktochart).
If you are using a free account, then you should only use the free templates. You can see the small highlighted word “FREE” at the bottom right corner of the templates that are free.
Step 5: On this screen, you can customize your infographic as per your choice in whichever way you want. For more info kindly look at the screenshot below.
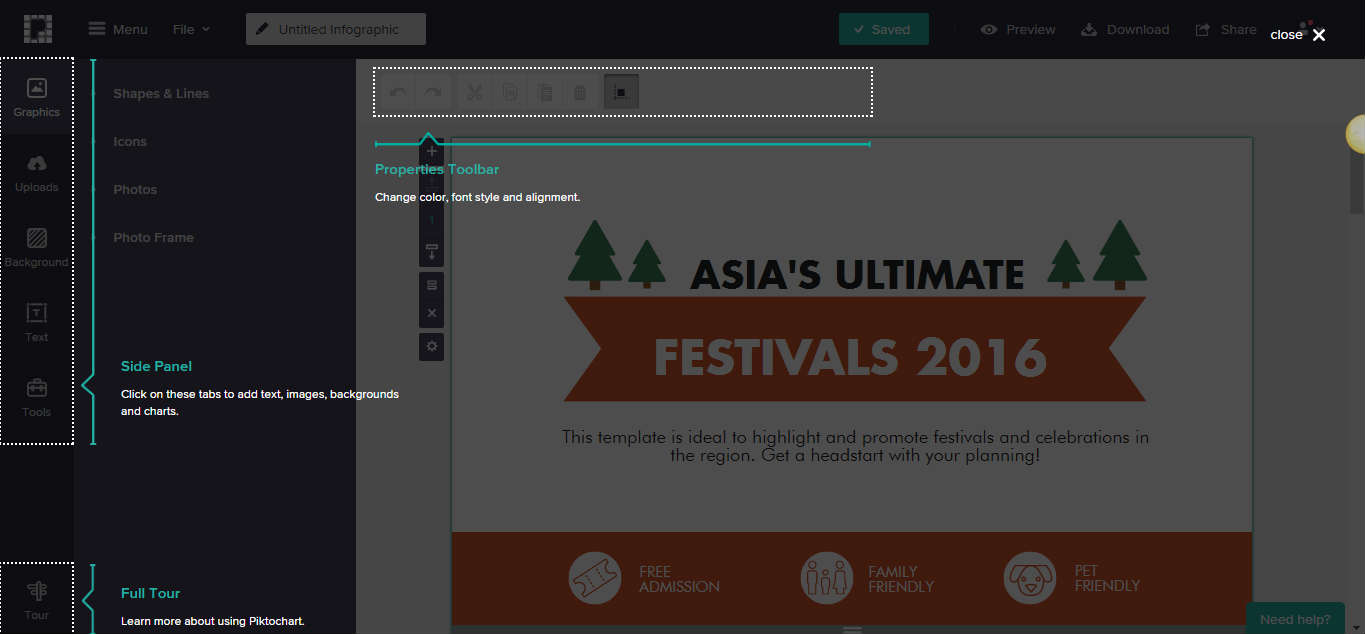
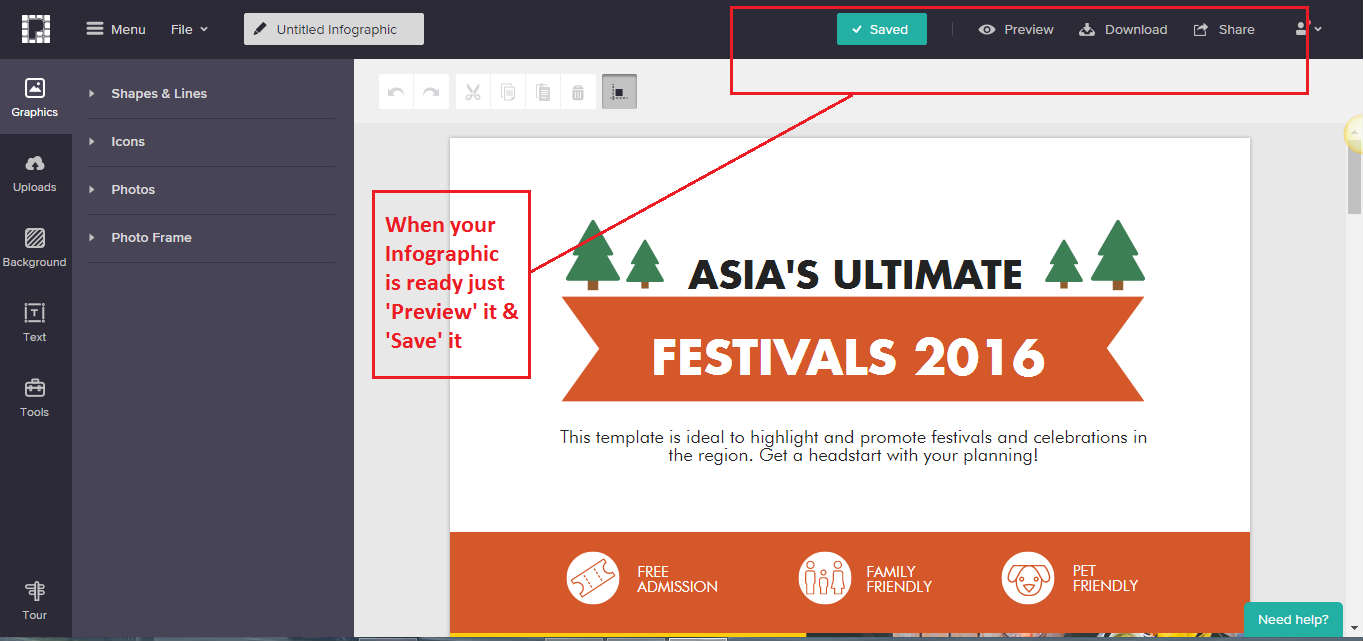
Step 6: Once you are done with the customization of your infographic. Just save it and your infographic is pretty much ready to use.
TUTORIAL #4: How to Create an Infographic Using Visme
Visme is an awesome tool to create some really attractive infographics. It also lets us create presentations, banners, etc.
Step 1: To start creating an infographic, go to Visme.co and create a free account (if you don’t have one).
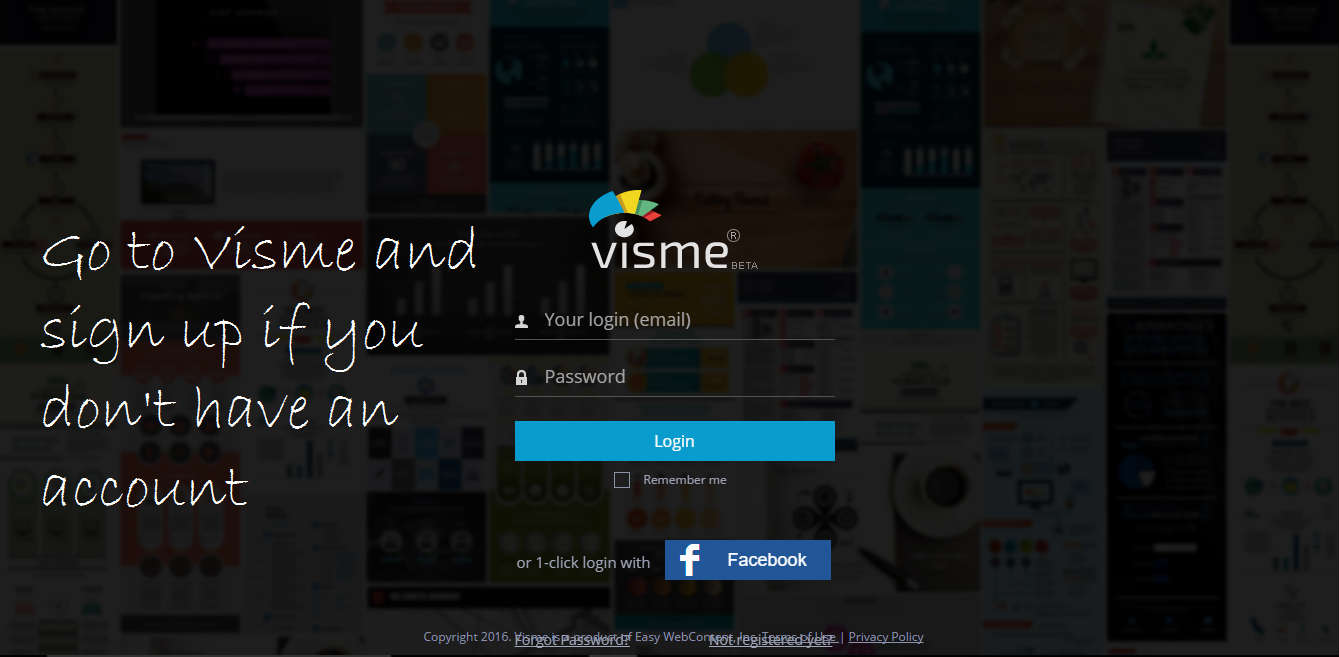
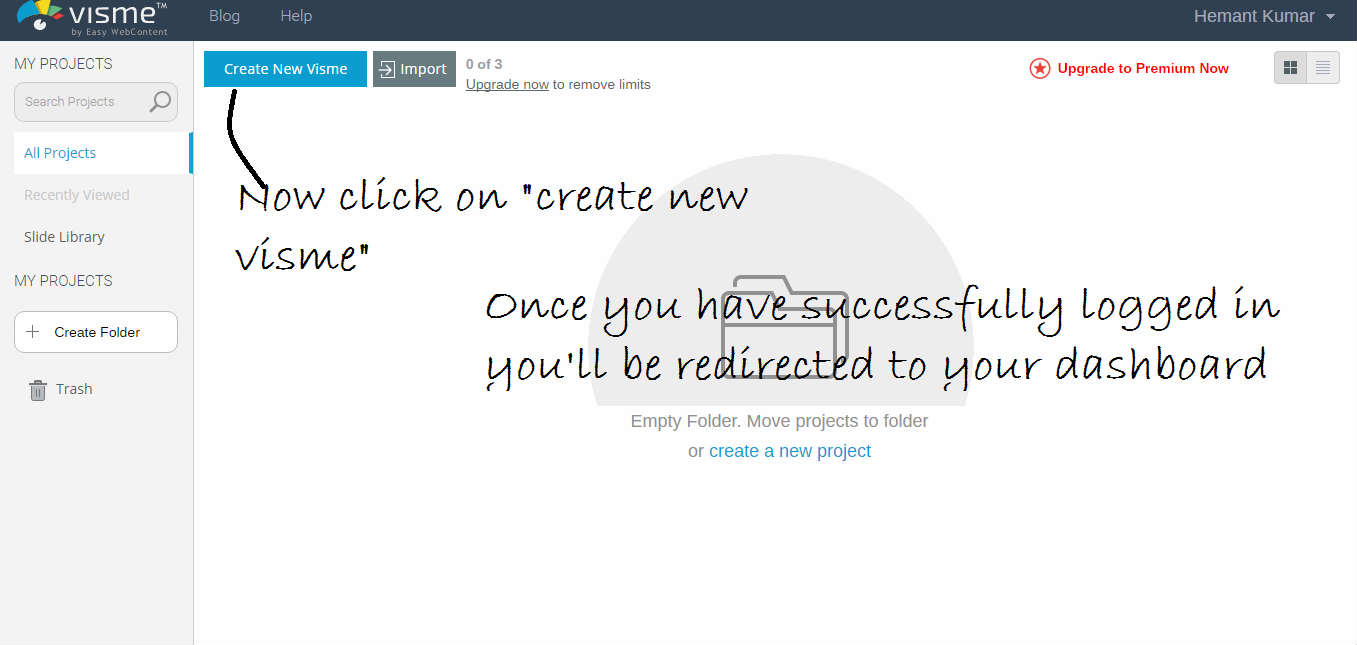
Step 2: Once once you have logged in, you’ll be redirected to your dashboard. Then click on “Create Visme” to start creating your infographic.
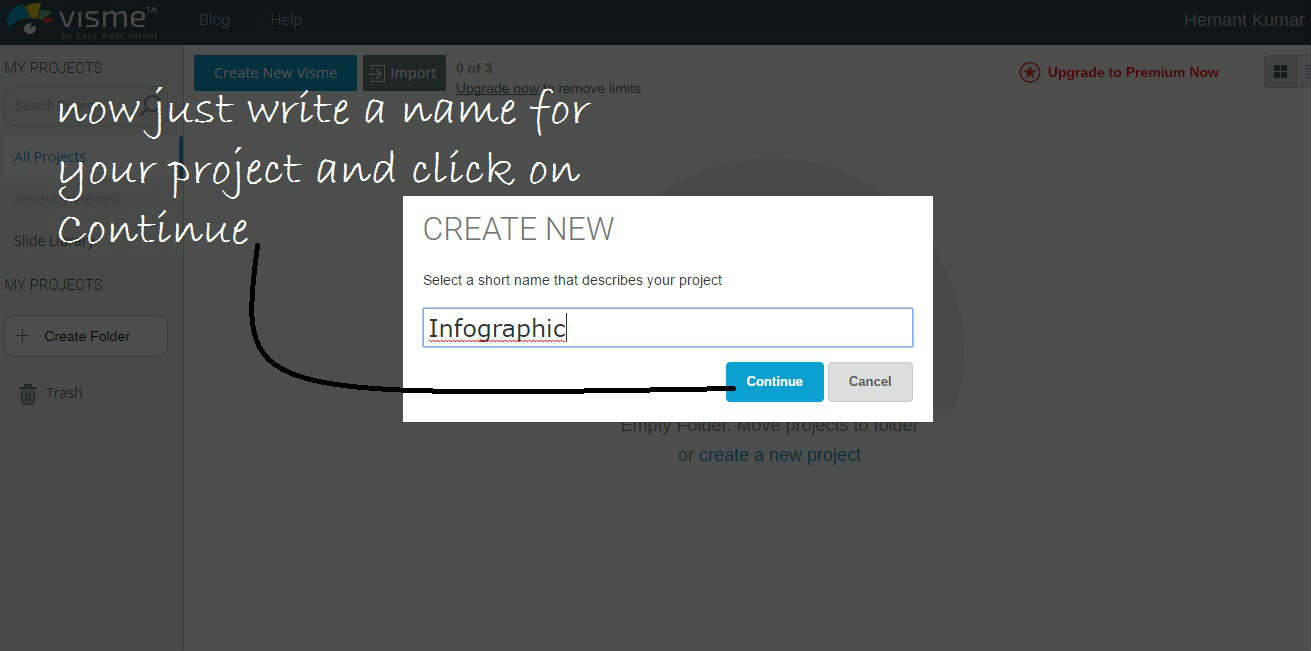
Step 3: Enter a name for your new project and then click on “continue.”
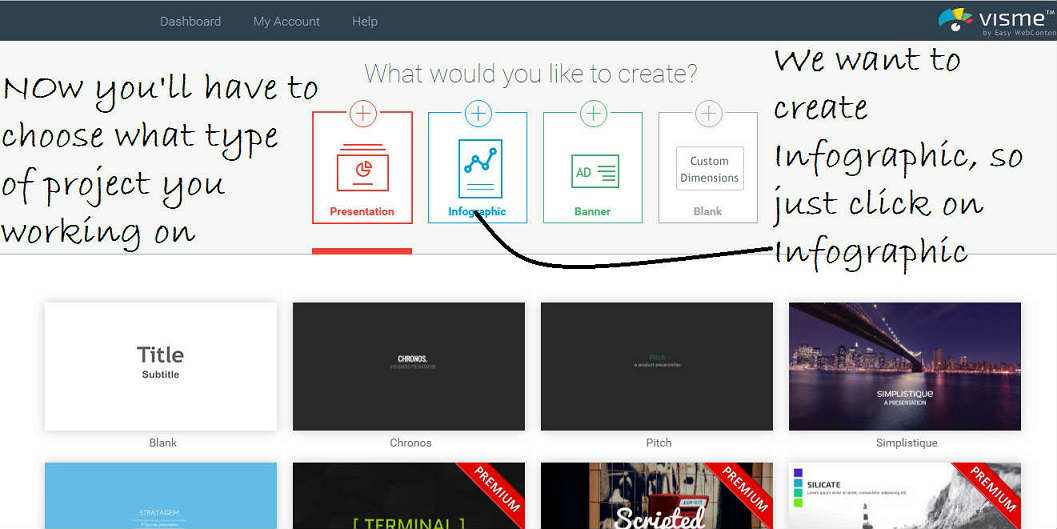
Step 4: Now you’ll see some categories at the top of the page. Choose “Infographic.”
Step 5: Now Visme will show you lots of templates. Some of them are free and some of them are premium. So if you are using Visme’s free version then choose any free theme by simply clicking on it.
Step 6: Now you’ll see that your chosen theme is open and now you can completely edit it.
You will have to completely edit all parts of your infographic here.

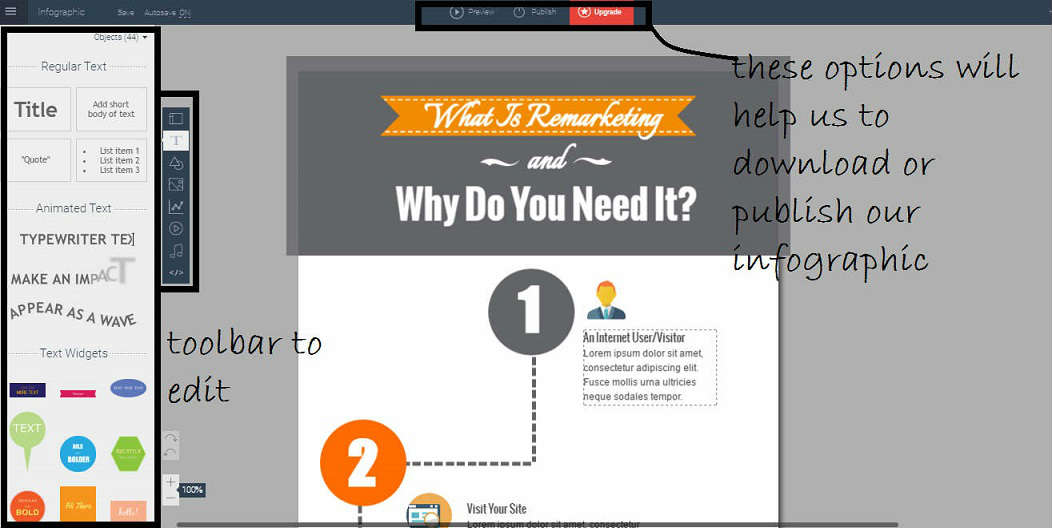
Step 7: On this page, you can see two toolbars, one on the left side and another at the top. See in below screenshot (we’ll discuss them later).
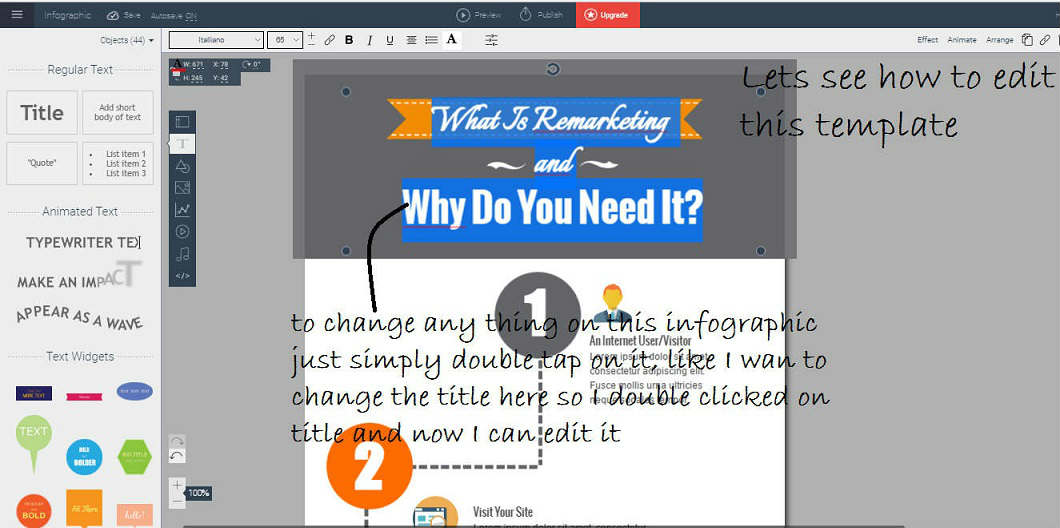
Step 8: To edit this theme, change any text on this theme just simply double-click on the text. For example, if I want to change the title then I’ll double-click on the title and then I can write whatever I want.

Step 9: To delete any icon in the infographic, just right click on the icon that you want to delete and then tap on the “Delete” option.
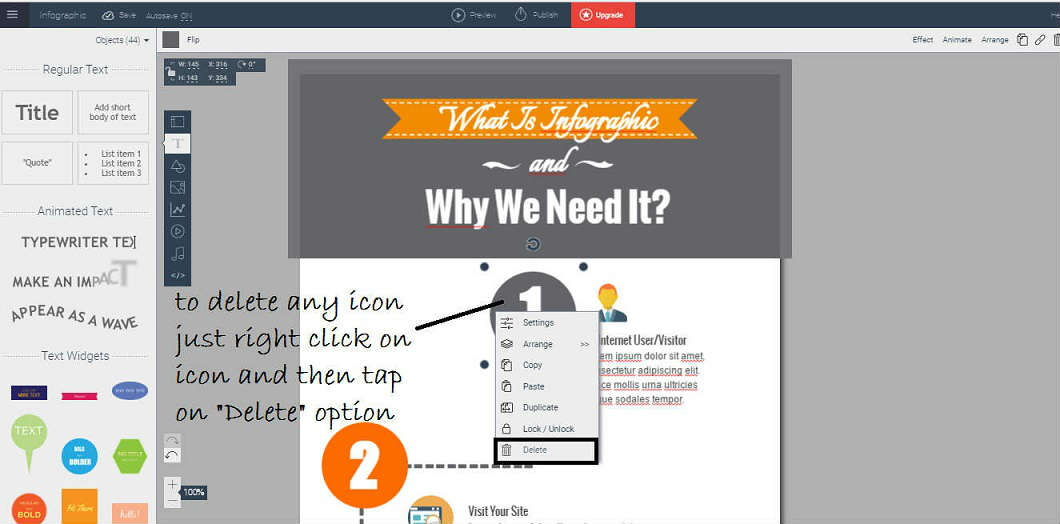
Step 10: To add any icons, images, or text to your infographic, you need that left sidebar which I have mentioned earlier. That left sidebar offers various options. Edit the ones you want!

Step 11: If you want to see a preview of your infographic or to download it, we’ll need that top toolbar, which I mentioned earlier. Preview it first.

Step 12: At last just simply click on “Download” option and you are all set.
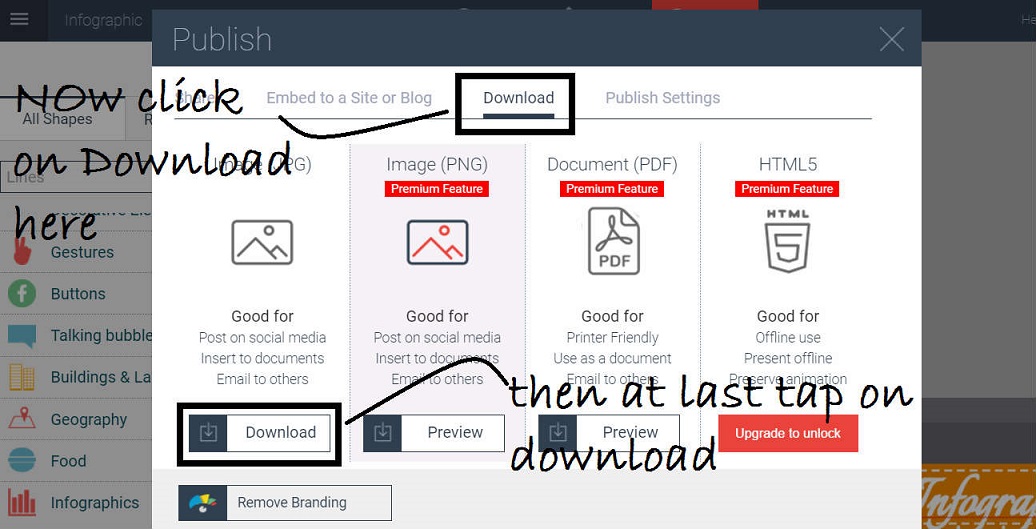
Now you have your Infographic, use it wherever you want to use it.
TUTORIAL #5: How to Create an Infographic Using Easel.ly
Step 1: Go to Easel.ly and sign up for a free account.
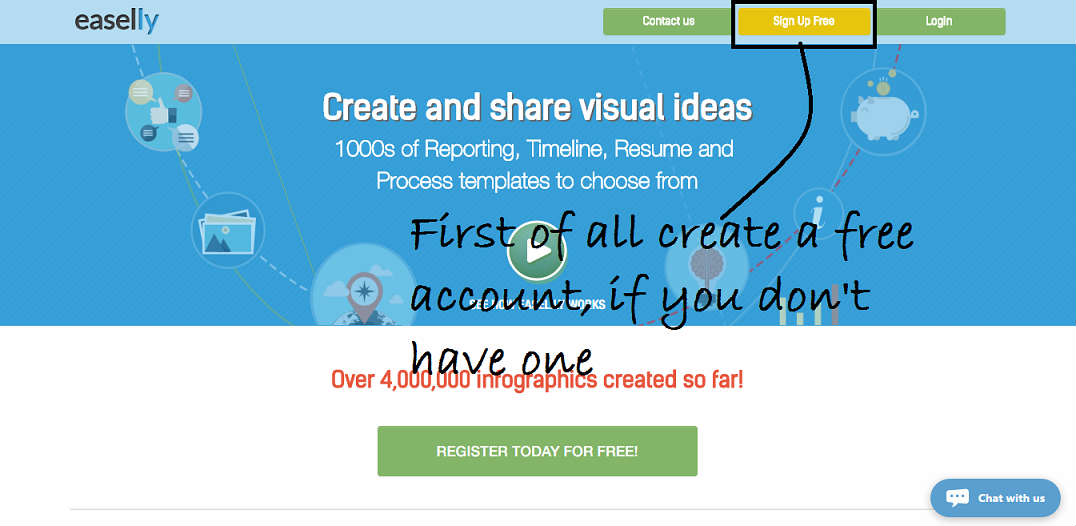
Step 2: Now once you have logged in, you’ll be redirected to your dashboard. From here you’ll have to choose any free template for your infographic.

Step 3: Now once you have clicked on any template, you’ll be redirected to the editing window.

Step 4: Now to edit anything on this infographic, just simply double-click on it and edit it. For example, to edit any text, double-click on it and write whatever you want.

Step 5: If you want to add an Icon, then click on “Objects” option from the toolbar.
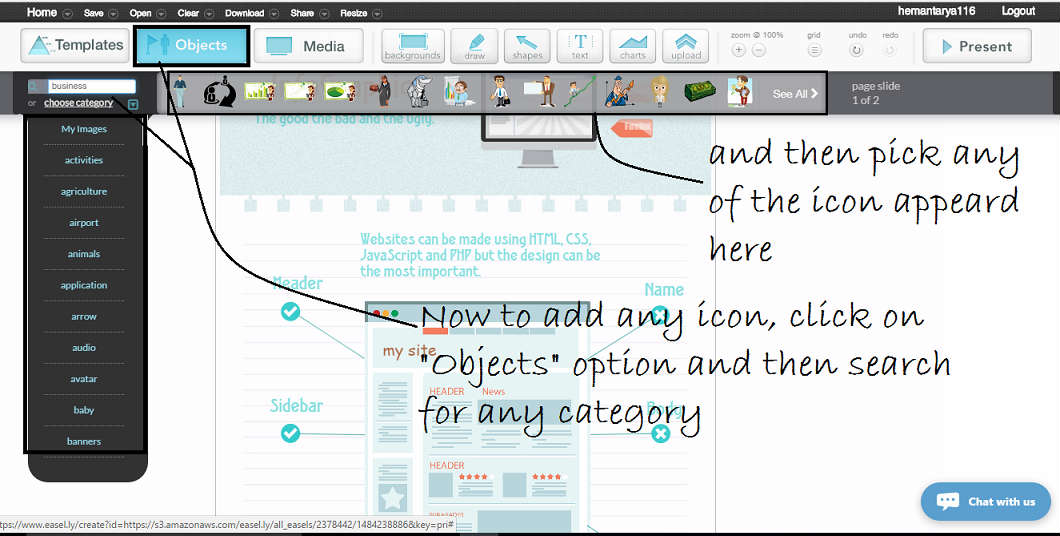
Step 6: If you want to add any media, then choose the “Media” option from the toolbar. If you want to add an image, then click on stock photos (by default you have chosen stock photos at the start), then search any image from the category list, like I have chosen the Business category.
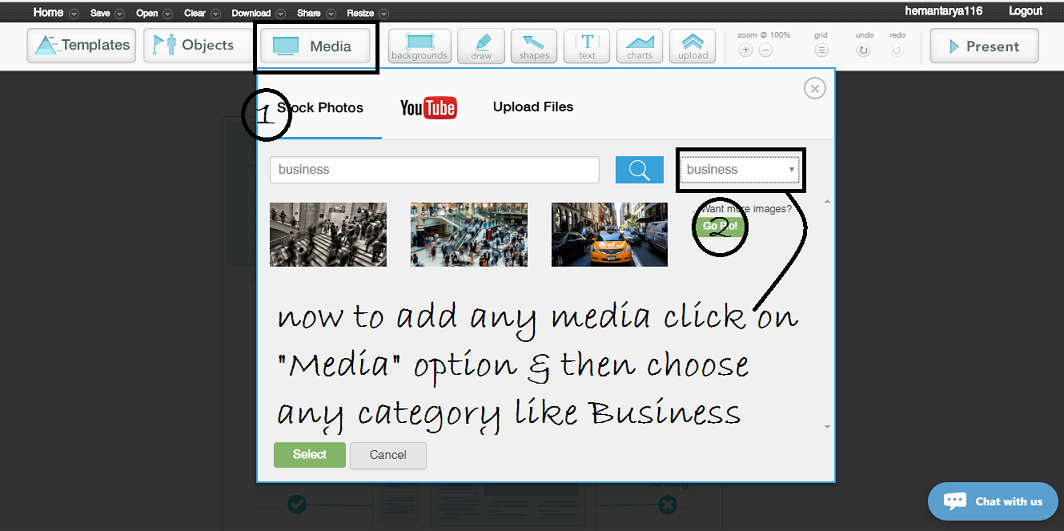
Step 7: Now edit the rest of your infographic by double-clicking on the part you want to edit.

Step 8: Once you have created your infographic, click on the “Download” button from the top toolbar and download your creation.
NOTE: You’ll have to choose the “Low Quality” option to start downloading because you are using the free version. If you want to download it in high quality, then upgrade your account. But that low-quality image which you can download now is not that bad at all.

Why You Should Start Creating Infographics TODAY
Infographics will help you get more traffic to your site because they will be shared by others!
They will boost your engagement on social media.
They will get you some backlinks, which will boost your site’s DA and PA.
They will help you earn more money.
Plus, people love visuals and Pinterest users prefer infographics!
Infographic Design Tips
For some excellent tips on designing infographics, read The Ultimate Infographic Design Guide: 13 Tricks For Better Designs.
And remember, as stated in 5 Types of Content That Will Boost Your Blog’s Traffic, keep the following in mind when you are designing your infographic:
- Remember your primary message as you choose your colors, typography, and layout
- Outline what you wish to visualize in your infographic to give actionable and factual information
- Learn the five fundamentals of good design: repetition, consistency, alignment, proximity, and hierarchy
- Email it to some of the influencers in your industry, and also share it on infographic sites like Visual.ly
Check the links below to learn more about how to create stunning infographics:
- How To Design The Best Blog Graphics With Free Tools And Design Theory
- The Ultimate Guide to Infographic Marketing
- 10 Steps To Designing An Amazing Infographic
- How to Skyrocket Your Traffic By Creating Viral Infographics
If you like this free guide, please make a small donation to Lorraine and Wording Well.
DONATE NOW!
I’d appreciate ANY amount!
Just buy me a coffee!
![It’s All About the Images [infographic by MDG Advertising] It’s All About the Images [infographic by MDG Advertising]](http://www.mdgadvertising.com/blog/wp-content/uploads/2012/05/its-all-about-images-infographic_1000.png)



Thanks for sharing such a nice article about infographic I got some awesome information from this article
Fantastic! I’m glad I could help!
Hey Lorraine
You’ve really gone above and beyond with this post. It’s so helpful.
You’ve taught me very useful tips for marketing with infographics.
Thank you SO much!
It’s been a while since I’ve read such a long post. I feel like I was being coached hehe
I’m definitely going to look at designing a few infographics for my next posts.
You ROCK!
Mozie @ BQPLR recently posted…How to Build a List with PLR
Mozie, it’s great to be appreciated. Thanks for letting me know how helpful I am!
Good luck with your infographics!
Lorraine this is a phenomenal guide. Love the detailed breakdown because IG’s are fabulous traffic builders, awesome ways to teach your audience. We tend to be visual creatures. IG’s lay out data and concepts in visual, easy to grasp and understand fashion. Rocking post.
Thanks, Ryan! There is so much to know about creating IGs but there are so many benefits to using them!
Hi Lorraine,
Infographics play an important role in making the blog posts informative. So this post is an amazing guide. I will surely be sharing this with all my friends.
regards,
Robin
Robin, I appreciate that you took the time to hop over here from Facebook to comment. Thank you for that! Thanks for sharing this post, too. Infographics are still very popular and a great way to share knowledge AND get traffic to your site!
Great article
Thanks, Dave!
Nice article i always visit your website to read stuff , your article writing skill is good, thank you so much , keep writing , thank you ,
Thanks, Aneeq!
Nice article
Thanks
This is very clear by this way learn infographic can be make very easy, very effective article for me. Thanks for sharing, excellent job.
Thanks for the comment. I’m glad you liked the post.
Great Guide!
Thanks!
It’s good to be back blogging after such a long break! I’ll admit, it’s tough getting back into it. But I have so much information to share! That’s why I’m doing it again!
Awesome! Keep sharing it!
Excellent info and tutorial about creating infographics.
Thanks! 🙂
The infographic is published as a content to a website, or as a social media update.Having a large publication or a famous blogger in the same industry sharing the infographic will be a big help to get a big traffic increase.
Sarah Taylor recently posted…How To Teach Your Singapore Child To Love Reading From A Young Age
True!
I think this is best post about creating infographics I have seen online, So detailed with information. I like to use the tools & your tips.
Keep posting!
Thanks so much. 🙂
If your audience is used to seeing one opinion on a topic voiced over and over again, offer a new perspective. Creating an infographic that offers a different opinion will get their attention.
Exactly!
Hi Larraine, well that’s a detailed preview of infographics thank you for sharing.
Jeevan shetty recently posted…Radhika Kumaraswamy Biography and Wife of “H.D Kumaraswamy” Complete Details.
Jeevan, I’m glad you liked it!
Thanks for sharing this detailed tutorial, I have posted about Infographics before but it was not as much detailed as your post.
I am mostly using Canva as it’s one the best tools I have come across. Not only for Infographics but for creating images and social graphics for posting on Facebook, Twitter and others.
I like Canva too. It’s so useful! 🙂
Hi Lorraine,
Thanks for sharing this detailed tutorial, I have posted about Infographics before but it was not as much detailed as your post.
I am mostly using Canva as it’s one the best tools I have come across. Not only for Infographics but for creating images and social graphics for posting on Facebook, Twitter and others.
Thanks for sharing.
Qasim, thanks for your comment. I am happy you enjoyed this tutorial. I love Canva!
Hey Lorraine,
It’s great to be reading your posts again. It’s always the best efforts you have put into your content, that’s why it will help many out there looking to learn.
By the way, Thanks for the great tool suggestions, Lorraine.
~ Donna
Donna Merrill recently posted…Top 3 Best Lacrosse Sticks for Attack
Donna, it’s good to be back blogging after such a long break! I’ll admit, it’s tough getting back into it. But I have so much information to share! That’s why I’m doing it again!
I hope you like the infographic creation tools!
Hello
Lorraine,
Such a nice post about infographics. This post covers all the necessary information about infographics. I am a graphic designer and love to design graphics, so it will not hard for me to design infographics for my blog. Here, great to know infographic can also help to boost website ranking on the search engines.
Happy to know that many people prefer to learn something visually and Infographics are liked and shared 3x more than other content.
Infographic helps to know more about the blog post than plain text only. You are right, infographics are also usually very easy to read and understand. I like the tutorial on how to create an infographic using Canva. Really, Canva is one of the best tools to create graphs. I use Corel Draw and Illustrator to create graphic designs.
You have well explained the whole content and it is very easy to understand. You did a great job and I will share this post on my social media accounts.
Thank you so much for sharing this wonderful post.
Have a great day ahead.
Praveen Verma
Praveen Verma recently posted…13 App Marketing Ideas You Haven’t Thought Of
Praveen, thanks for your comment and the compliments on this infographics guide. I didn’t know you were a graphics designer! That’s awesome!
Thanks for sharing this guide on social media. I appreciate it!
By the way, I like Canva the best of all the design tools. 😉
I was reading about infographics from many days but this post has all information I need. Thanks for creating such a nice an informative post.
I will share this with few of my friends.
I have a question, can I create an infographic for my food blog. Can it help in any way?
I have started a food blog as all of you in BHB were talking about niches. I thought, I can share recipes, it’s easy for me.
Regards
Pinky Khan
Thanks again.
Dania recently posted…Dinner Rolls Recipe
Pinky, yes you can create an infographic for your food blog! (And congratulations for starting a blog!)
You could easily turn a recipe into an infographic.
You could also create an infographic about “kitchen tips.”
I’m sure the possibilities for infographic topics are endless!
To find out more, why don’t you try searching for some infographics on Pinterest, and see what other bloggers are doing. If you find one that needs improving, make one on THAT topic, and then share it with the creator of the one you found AND the people who follow that board. 🙂
That way, you are helping others, doing blogger outreach, and getting traffic to your new site ALL AT ONCE!
A beautifully crafted blog post with in-depth information infographics.
Regards!
Umer Idrisi recently posted…4 Google Penalty Safe Link Building Ways to Rank Better
Thanks, Umer! 🙂
Excellent info and tutorial about creating infographics. In fact, it’s the best I’ve seen so far. I’ve bookmarked it and will pull it out next time I create an infographic.
Congratulations on a fine article, Lorraine!
Thanks so much, Mary!
I appreciate you stopping by to leave a comment. I also appreciate that you shared this! 🙂
I know you have a team that creates infographics for Write to Done. They are fantastic!
But not everyone has a big budget, especially new bloggers, and that is why I provided the tutorials in this guide. They can create their own infographics for free, with a little bit of time and effort.
I know some of your audience will appreciate this.
Thanks again for the support and the shares! Keep on rockin’ it, Mary!
As you know, Write to Done was one of the first blogs I started following over five years ago, when I began my online journey. It remains one of the few blogs I still make time to read. 🙂
Keep on rockin’ it, Mary!
Hi Lorraine,
This is indeed an ultimate guide and I have learned a lot from it. Infographics are phenomenal content types that can drive massive traffic in the shortest time possible. Infographics are a great way to share information visually, that is why 41.5% of marketers said that graphics like infographics are the most valuable content.
People follow visual instructions 323% better than written instructions which is why infographics are great. Although I haven’t create one before, your guide is all I needed to get one ready. I’m more comfortable, or shall I say convenient with Canva. I will definitely give it a try.
Thanks to sharing Lorraine.
Moss Clement recently posted…8 Undeniable Ways to Build Brand Trust on Social Media
Moss, I created only a few infographics, too, but I am also going to be more comfortable now, moving forward with image and infographic creation.
Thanks so much for the compliment and for sharing this. I’m grateful to have built up a relationship with you, too. 🙂
Blog on, brother!